Usage Reports
Overview
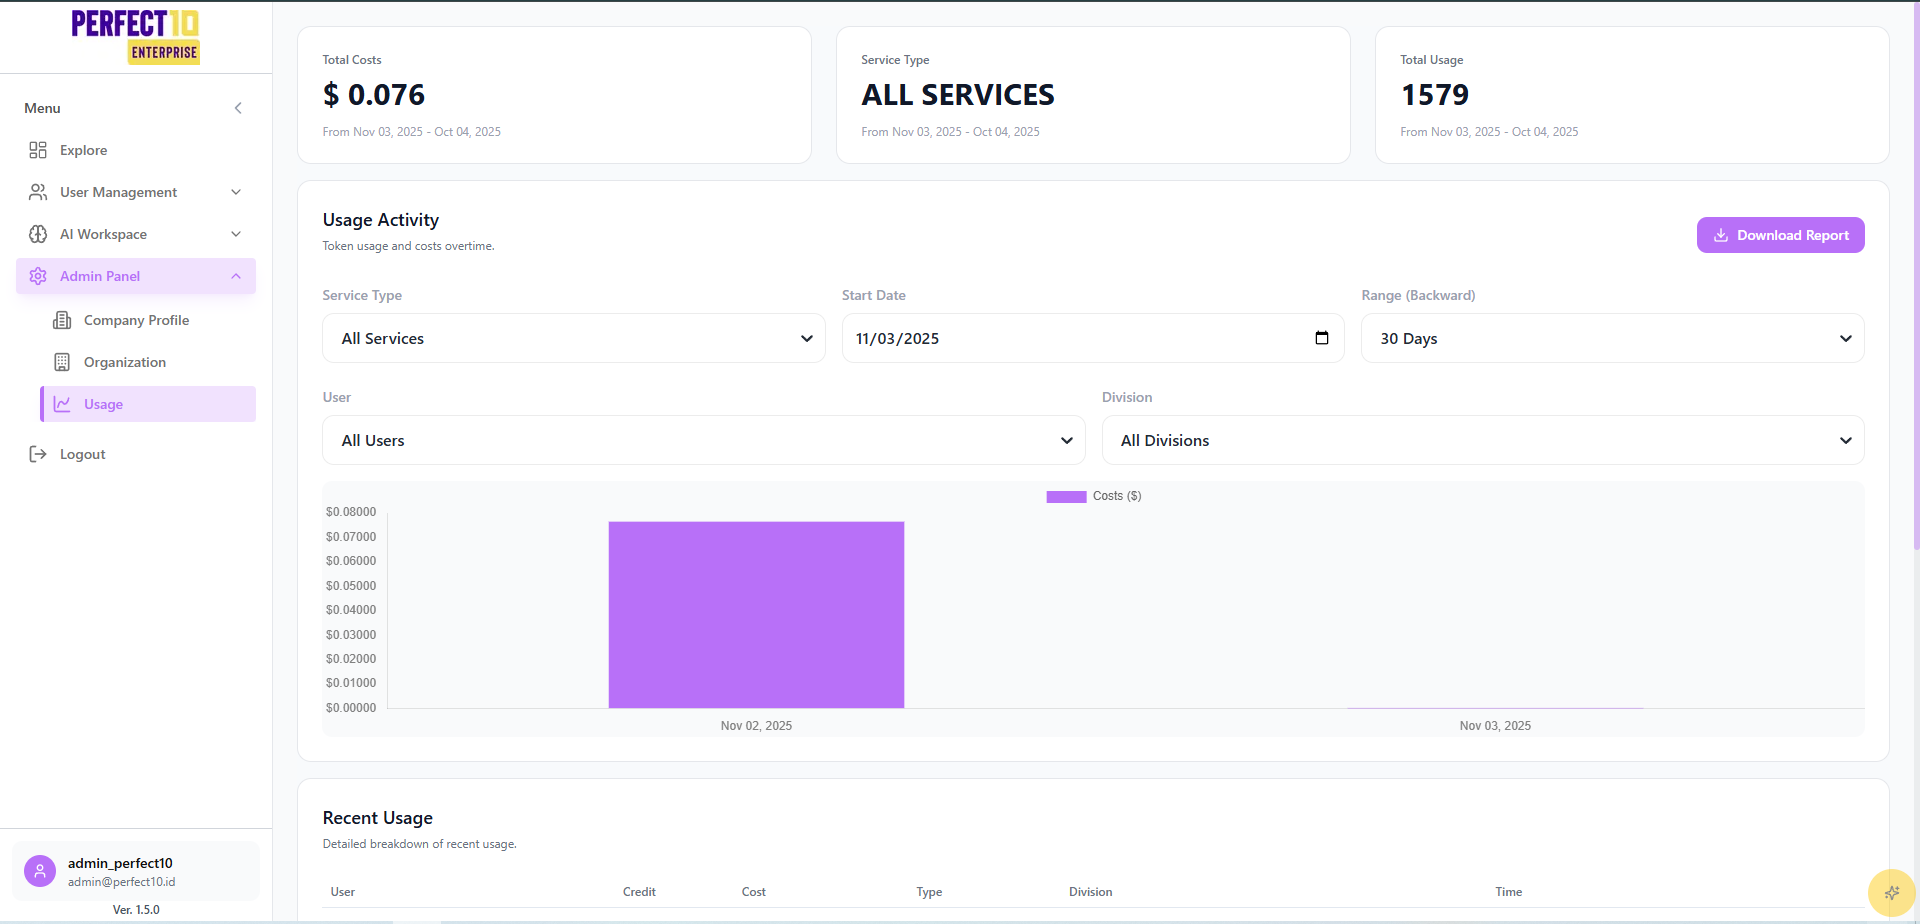
The Usage Reports dashboard provides administrators with visibility into platform activity, resource usage, and associated costs.
It helps track system consumption by user, division, and service type, supporting transparency, budgeting, and performance optimization.
Dashboard Features
- Total Costs – Displays total expenditure within the selected date range.
- Total Usage – Shows the number of tokens or service operations performed.
- Service Type Filter – Narrow results to All Services, LLM, Embeddings, Web Search, or URL Access.
- Date Range Selector – Define a start date and analysis window (e.g., past 30 days).
- User & Division Filters – Focus reports on specific users or departments.
- Download Report – Export results to an Excel file for financial or operational review.
Usage Trends
A time-series graph visualizes cost and activity over time, allowing administrators to identify spikes, usage anomalies, and optimization opportunities.
Recent Usage Table
| Username | Role | Usage Count | Cost (USD) | Service Type | Division | Timestamp |
|---|---|---|---|---|---|---|
| user_admin | Admin | 1,579 | $0.076 | LLM | Default Division | Nov 3, 2025, 09:07 AM |
| user_staff01 | Staff | 963 | $0.0078 | LLM | Research & Development | Nov 2, 2025, 01:11 PM |
| user_manager01 | Manager | 122 | $0.0001 | LLM | Default Division | Nov 2, 2025, 09:45 PM |
Values above are sample metrics for illustration.
Accessing Usage Analytics
- Navigate to https://perfect10.id/usage.
- Apply desired filters:
- Service Type
- Date Range
- User
- Division
- Review Total Costs and Total Usage metrics.
- Analyze patterns in the Usage Cost Over Time chart.
- Examine details in the Recent Usage Table.
- (Optional) Use Download Report to export the data.
Best Practices
- Monitor Regularly – Review usage weekly to identify cost spikes or inefficiencies.
- Optimize Service Allocation – Use division-based filters to understand workload distribution.
- Review High-Usage Accounts – Detect unusual or unexpected activity patterns.
- Export Reports – Maintain archived reports for budgeting and audit purposes.
Note: Usage data updates in near real time.
Tip: Compare divisions or users to identify optimization opportunities and forecast future resource needs.