Dashboard
Overview
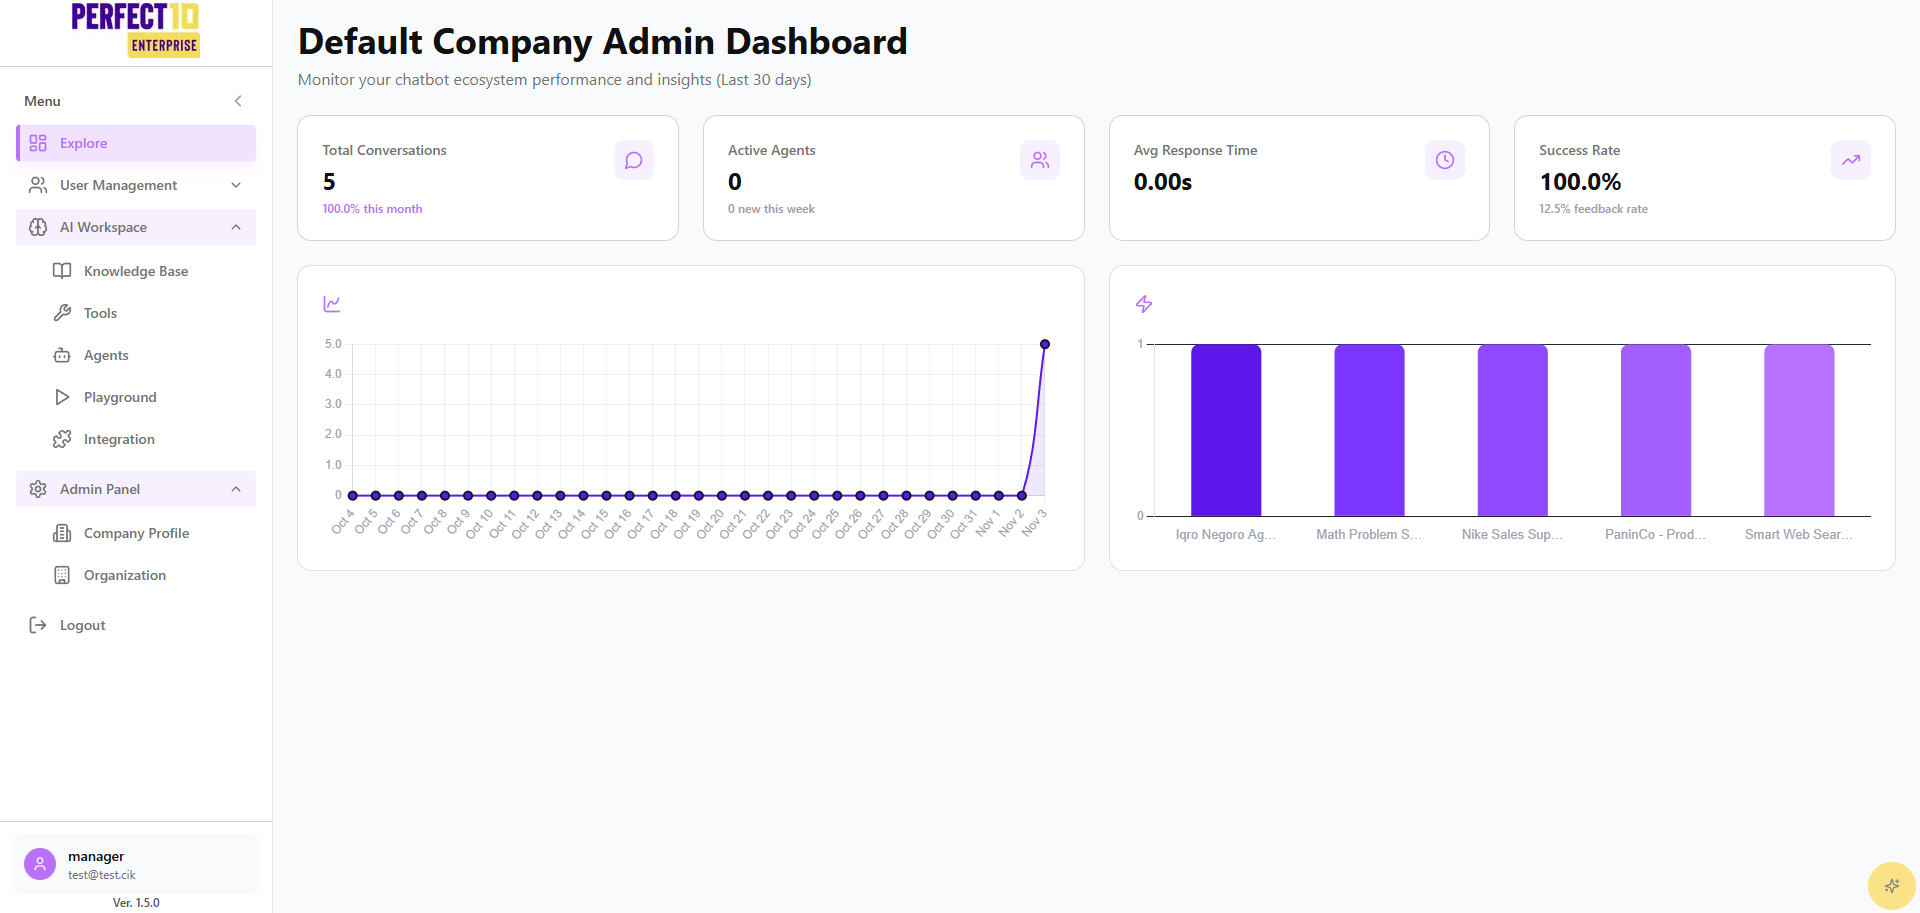
The Manager Dashboard is the central navigation hub for division-level operations within the Perfect10 platform. Accessible via https://perfect10.id/explore, it surfaces real-time insights into AI agent activity, conversation trends, and workspace assets over the past 30 days.
Platform Layout
| Element | Description |
|---|---|
| Logo | Displays the Perfect10 brand in the top-left corner. |
| Sidebar Menu | Provides access to Explore and AI Workspace sections tailored to manager permissions. |
| Dashboard Cards | Show key metrics such as Conversation Volume, Active Agents, and Average Response Time. |
| Graphs | Visualize conversation trends and agent performance for rapid diagnostics. |
| Account Panel | Bottom-left area showing manager name, email, and platform version. |
Menu Structure
Explore
Designed for day-to-day oversight of people and access within your division:
- User Management - Limited to
InvitationandEmployeescontrols for staff. - Invitation - Generate staff onboarding codes within your division scope.
- Employees - Monitor and toggle staff account status.
AI Workspace
Tools for configuring and validating conversational experiences:
- Knowledge Base - Maintain division-approved content sources.
- Agents - Create, tune, and assign agents using approved models.
- Playground - Test conversational flows before deployment.
- Integrations - Enable REST and web widget access for division rollouts.
- Tools - Activate internal or external tools that have been pre-approved by Administrators.
Logout
Securely end the manager session from any page.
Managers do not have access to Admin Panel modules such as Company Profile, Organization, or Usage Analytics. Escalate those needs to an Administrator.
Dashboard Metrics
- Conversation Volume - Tracks total interactions handled by division agents.
- Active Agents - Shows how many agents are currently enabled.
- Average Response Time - Highlights conversational latency for optimization.
- Agent Performance - Ranks agent effectiveness based on recent activity.
- Trend Analysis - Displays day-by-day interaction patterns to spot anomalies.
Tip: Review graphs weekly to identify peaks, then adjust knowledge base content or agent settings before they impact service quality.